Adult Learners in Urban Environments: Exploring the Intersectional Experiences of Students in Chicago
By Karla Velasco

According to the 2021 report on adult learners in Chicago, this population is defined by age, social roles, or self-perception as adults with a standard age threshold of 25 years and older (Brown et al., 2021). Adult learners also encompass multiple roles, such as having dependents, working full time, and being financially independent. Some have served in the military (Brown et al., 2021). Recent data from the Lumina Foundation indicate that degree attainment has increased among adults in the 25- to 34-year-old age range, suggesting a rise in this group completing college degrees (Lumina Foundation, 2024). Given the increasing number of adult learners in higher education, when examining the experiences of this group, it is essential to consider their experiences in urban environments.
Learning is deeply embedded in socio-spatial contexts, where regional dynamics and environments influence learning processes (Broek et al., 2024). In particular, Chicago is one of the largest metropolitan cities in the United States with a large adult learner population. In 2018, adults aged 25 and older constituted about two-thirds of Chicago's population. According to the U.S. Census Bureau (2023), about 61.8% of the total population is over the age of 30. Broek et al. (2024) examine the intersection of age, race, and ethnicity to better understand the needs of adult learners in Chicago. This data shows that in 2018, the Chicago adult population over 25 primarily identified as White (37%), primarily identified as Black or African American (29%) and identified as Latinx (25%). (Figure 1 and Table 1 below have complete racial and ethnic data).
Figure 1
Pie Graph Displaying the Racial and Ethnic Percentage Distribution of the Chicago Adult Population
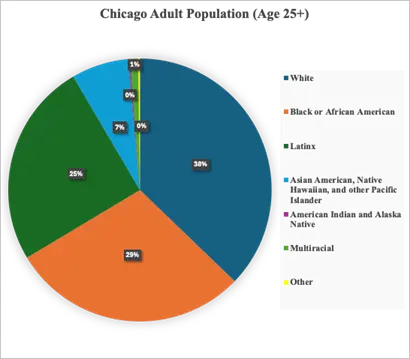
Source: Brown et al.’s (2021) calculations using the American Community Survey five-year estimates, 2014–18.
Table 1
Table Displaying the Racial and Ethnic Percentage Distribution of the Chicago Adult Population
| Race and Ethnicity | Percent | Total |
| White | 37% | 663,756 |
| Black or African American | 29% | 533,899 |
| Asian American, Native Hawaiian, and other Pacific Islander | 7% | 126,698 |
| American Indian and Alaska Native | 0.20% | 2,830 |
| Multiracial | 1% | 24,828 |
| Other | 0.20% | 3,643 |
Source: Brown et al.’s (2021) calculations using the American Community Survey five-year estimates, 2014–18.
Data on Chicago Public School Students
Race and ethnic identity are critical when examining data from the To & Through Project, which generates data to achieve equitable educational outcomes for students in Chicago Public Schools (CPS). The data from the project examines college enrollment data for 2023 high school graduates from CPS who enrolled in college in the fall of 2023. It also examines college competition data from 2017, as well as immediate enrollees from CPS who completed a degree or credential by the spring of 2023. When examining this data, a relationship is observed between free and reduced lunch, race, college enrollment, and college completion.
Free or reduced lunches and Black Students
Four Chicago community areas with over 80% of students who were eligible for free or reduced lunches were also the top neighborhoods with the lowest college completion rates in Chicago. West Garfield Park has a 48% college enrollment rate and a 25% college completion rate. Englewood and Woodland have slightly higher enrollment rates, with Englewood at 55% and Woodlawn at 57%. Both neighborhoods have the same college completion rate: 26%. The neighborhoods with over 80% of students who were eligible for free or reduced lunches also have over 80% of Black students. The community areas with the highest percentages of Black students also have the lowest college enrollment rates and the lowest completion rates.
Latinx students
When filtering the data by Latinx community areas, areas with above 80% Latino students have college enrollment rates about 10% higher than those with more than 80% Black students. Examples include South Lawndale (63%), Hermosa (63%), Montclare (71%), and Belmont Cragin (65%). The college completion rates are also higher in neighborhoods with a majority of Latinx students: South Lawndale at 44%, Hermosa and Mont Clare at 46%, and Belmont Cragin at 47%.
Asian/Pacific Islander students
College enrollment and college completion rates continue to increase in neighborhoods that have more than a quarter of Asian/Pacific Islander students. There are only three neighborhoods that have over 28%[1] Asian/Pacific Islander students: McKinley Park, Bridgeport, and Armour Square. At McKinley Park, the college enrollment rate is 66%, and the college completion rate is 53%. Bridgeport's college enrollment is 74%, and 65% of students complete college. Armour Square has a 75% college enrollment rate and a 67% college completion rate.
[1] Percentages were adjusted to include at least three community areas in the list, which is why the percentages differ for each category.
White students
Lastly, Chicago community areas with more than 55% White students have the highest college enrollment and college completion rates. Mount Greenwood has 68% college enrollment and the same college completion rate. Edison Park has an 80% college enrollment and a 71% college completion rate. North Center has an 84% college enrollment rate and a 72% college completion rate, and O'Hare has a 69% college enrollment rate and a 77% college completion rate.
City Colleges of Chicago - Wilbur Wright College
When examining data from Wilbur Wright College, one of Chicago’s seven community colleges, similar trends are observed regarding race and ethnicity. The 2023 three-year college completion rates of 2020 CPS graduates at City Colleges of Chicago-Wilbur Wright College examine the intersection of race and gender. Twelve percent of Black young men who immediately enrolled in college completed a two- or four-year degree within three years, compared to 31% of Black young women. Twenty-two percent of Latino young men who immediately enrolled in college completed a two- or four-year degree within three years, compared to 34% of Latina young women. This was similar to Asian/Pacific Islanders, a group in which 23% of young men who immediately enrolled completed a two- or four-year degree within three years compared to 32% of young women. White students at Wright College have the highest completion rates. Specifically, 37% of White young men who immediately enrolled in college completed a two- or four-year degree within three years, compared to 44% of White young women.
Immigrant Adult Learners with Limited Formal Education
According to Brown et al. (2021), another characteristic of Chicago residents over the age of 25 is that more than a quarter of them (27%) were born outside of the U.S. This means that a large number of adult learners in Chicago are immigrants. Entigar (2021) emphasizes the importance of respecting students' diverse backgrounds and experiences, particularly those of refugees and immigrants.
Students with limited or interrupted formal education (SLIFE) are a unique subset of adult learners, often immigrants and refugees, who face significant challenges in adult education programs (Housel & Nikoui, 2024). These challenges stem from gaps in their education, often caused by various factors such as conflict, displacement, or cultural barriers. Understanding and addressing their specific needs is crucial for effective instruction and integration.
Practical Recommendations to Support Adult Learners in Urban Environments
Entigar (2021) emphasizes the importance of teachers being sensitive to the potential for re-traumatization when discussing students' countries of origin or personal histories. They discuss practical considerations for teachers, trauma-informed teaching pedagogies, and strategies to support students with trauma. Entigar emphasizes the importance of self-determination and self-regulation in adult learning, as some adults in their study noted that they did not feel comfortable participating in activities that liberal teachers intended to be inclusive. They also related that some students felt unsafe about discussing their cultural background, which is often done in classrooms, especially if they are immigrants who have experienced trauma. It is vital to enact trauma-informed teaching to be conscious of these experiences, regardless of whether teachers may have good intentions in conducting both inclusive activities and in asking students to share their backgrounds. Strategies that teachers can also utilize in the classroom include developing individualized education programs (IEPs) and offering accommodations for adult learners.
In addition, building learning cities represents a strategic approach to promoting lifelong learning at the urban level (Broek et al., 2024). This involves creating comprehensive urban environments that support continuous learning, skill development, and community engagement. According to Yang (2012), the core objective is to transform cities into dynamic ecosystems where learning becomes an integral part of social and economic development (Broek et al., 2024). The UNESCO Global Network of Learning Cities provides a framework for implementing this strategy, emphasizing the importance of collaborative efforts between individuals, communities, and institutions (Broek et al., 2024). By integrating learning into urban planning and development, these cities aim to foster a culture of lifelong learning that empowers residents across different age groups and backgrounds. The approach extends beyond traditional educational institutions, offering multiple learning opportunities through local learning centers, partnerships with businesses, and community-based initiatives that promote inclusion.
Key Takeaways
Adult learning is a holistic, multi-level process (Broek et al., 2024). Adult learners are diverse and cannot be defined by a single characteristic. Targeted support is crucial for various subgroups, including the provision of flexible learning options, childcare assistance, financial support, and digital skills development (Brown et al., 2021). Specifically, according to Housel and Nikoui (2024), it is essential to best support SLIFE learners by appreciating culturally responsive pedagogy and engaging culturally competent teachers. Further research, improved teacher preparation, and administrative support are needed to address the unique needs of this population.
References
Broek, S., Kuijpers ,Maria Anna Catharina Theresia, Semeijn ,Judith Hilde, & and van der Linden, J. (2024). Conditions for successful adult learning systems at the local level: Creating a conducive socio-spatial environment for adults to engage in learning. International Journal of Lifelong Education, 43(2–3), 200–223. https://doi.org/10.1080/02601370.2024.2338366
Brown, M., Spaulding, S., Montes, M., & Durham, C. (2021). Understanding the Needs of Adult Learners in Chicago: A Data Profile. Urban Institute. https://eric.ed.gov/?id=ED616284
Entigar, K. E. (2021). To choose not to be included: Critical perspectives on practices of inclusion with adult immigrant students. International Review of Education / Internationale Zeitschrift Für Erziehungswissenschaft, 67(6), 833–849. https://doi.org/10.1007/s11159-021-09933-7
Housel, D. A., & Nikoui, M. (2024). Practical Recommendations for Accommodating Students With Limited or Interrupted Formal Education in Adult Education Programs in the United States. Adult Learning, 1. https://doi.org/10.1177/10451595241297660
Lumina Foundation. (2024, January 31). New Federal Data Show More Adults Earning College Degrees. Lumina Foundation. https://www.luminafoundation.org/news-and-views/a-stronger-nation-new-federal-data-show-more-adults-earning-college-degrees/
Success, Uc. I., The UChicago Consortium, The Network for College. (2023). To&Through Higher Ed Milestones Tool—City Colleges of Chicago-Wilbur Wright College Attainment Data. Retrieved June 1, 2025, from https://toandthrough.uchicago.edu/tool/cps/he/2023/school/165500/details/#/completion
Success, Uc. I., The UChicago Consortium, The Network for College. (2023). To&Through Community Milestones Tool—Chicago Public Schools (CPS) Data. Retrieved June 18, 2025, from https://toandthrough.uchicago.edu/tool/cps/comm/2023/#/milestones/via-schools?f=asian(0.28~1)&ctr=41.8389'-87.7457&z=10.0&o=_cg_grad
U.S. Census Bureau (2023). American Community Survey 1-year estimates. Retrieved from Census Reporter Profile page for Chicago, IL < http://censusreporter.org/profiles/16000US1714000-chicago-il/>
Appendix
Percent Free and Reduced Lunches Above 80%
| Community Area Name | College Enrollment | College Completion |
| West Garfield Park | 48% | 25% |
| Englewood | 55% | 26% |
| Woodlawn | 57% | 26% |
| West Englewood | 54% | 27% |
Percent Black Students Above 80%
| Community Area Name | College Enrollment | College Completion |
| West Garfield Park | 48% | 25% |
| Englewood | 55% | 26% |
| Woodlawn | 57% | 26% |
| Douglas | 57% | 28% |
Percent Asian/Pacific Islander Students Above 28%
| Community Area Name | College Enrollment | College Completion |
| McKinley Park | 66% | 53% |
| Bridgeport | 74% | 65% |
| Armour Square | 75% | 67% |
Percent White Students Above 55%
| Community Area Name | College Enrollment | College Completion |
| Mount Greenwood | 68% | 68% |
| Edison Park | 80% | 71% |
| North Center | 84% | 72% |
| O'Hare | 69% | 77% |
Percent Latino Students Above 80%
| Community Area Name | College Enrollment | College Completion |
| South Lawndale | 63% | 44% |
| Hermosa | 63% | 46% |
| Montclare | 71% | 46% |
| Belmont Cragin | 65% | 47% |